Watching an AI app in production
Next in my MLOps journey: tracing prompts, tokens, cost and quality.
Next in my MLOps journey: tracing prompts, tokens, cost and quality.
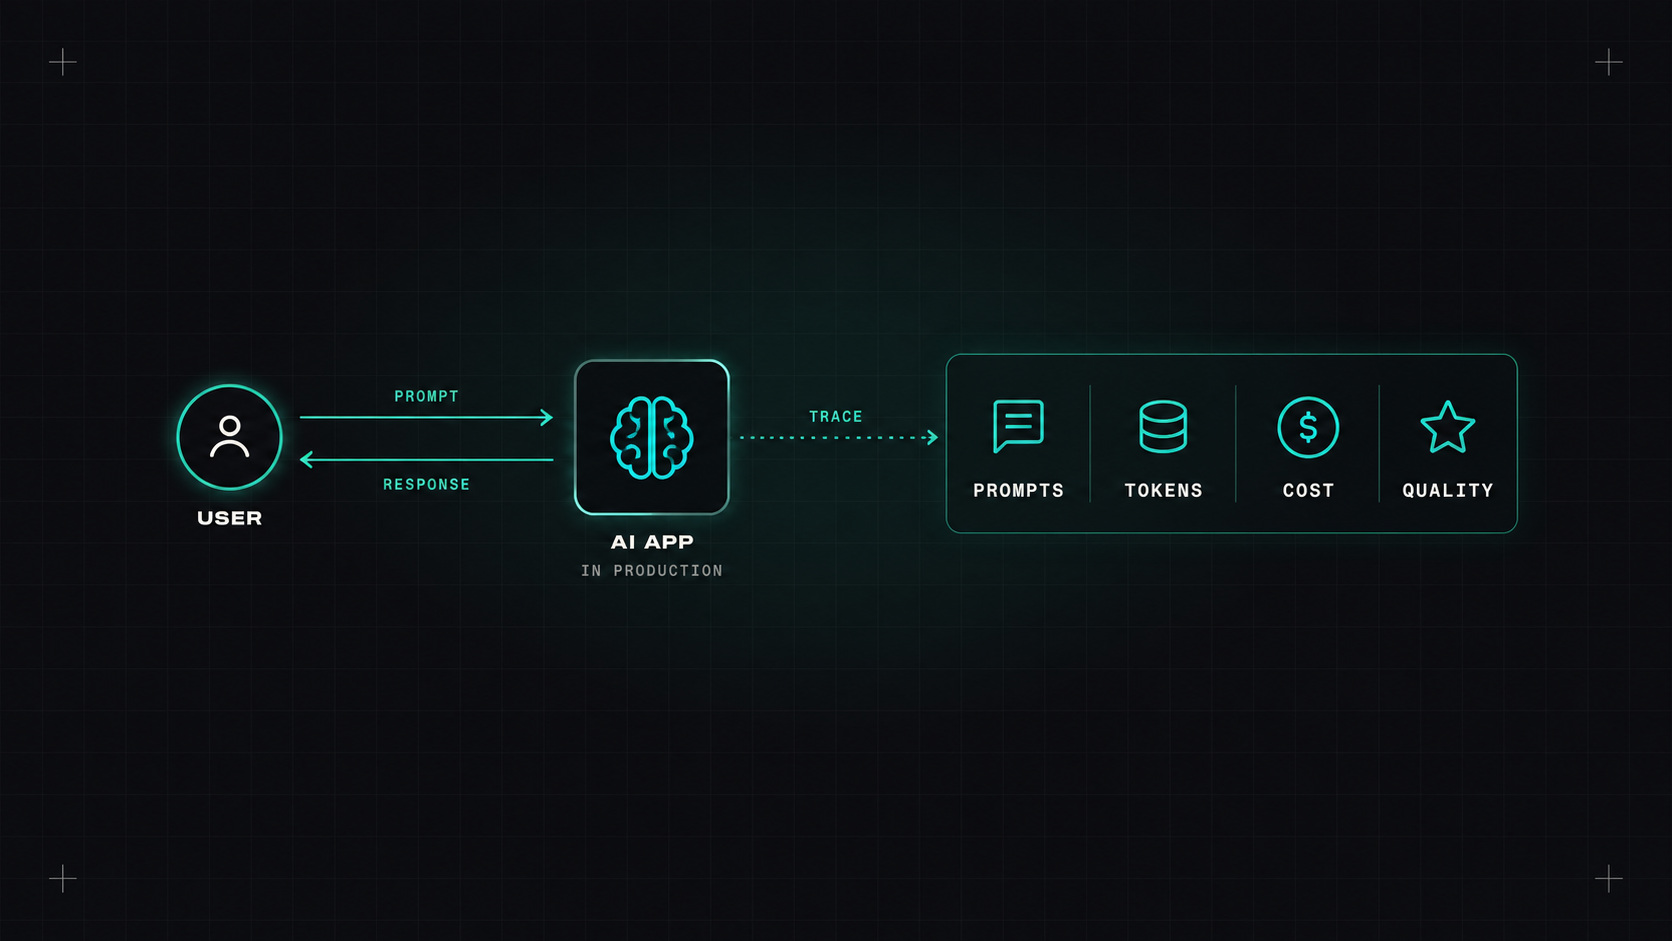
My MLOps learning plan ends with monitoring dashboards, using Prometheus, Grafana and Evidently. When I wrote that plan, I thought of monitoring the way I do in DevOps: is it up, is it fast, is it throwing errors?
The more I learn, the clearer it gets that AI systems need a second layer. A model can be up, fast and error-free, and still give terrible answers. This post is about watching that second layer.
I think of it in three levels.
1. The usual service health. Everything we already monitor: request rate, error rate, latency, resource use. An AI service is still a service.
2. Model-specific operations. For LLM applications especially:
3. Quality. The hard one:
For normal software, "no errors" means it's working. For AI, "no errors" just means it's confidently doing something.
A single request to an AI feature can involve many steps: retrieving documents, building a prompt, calling a model, calling tools, calling the model again. When the answer is bad, you need to see every step.
That's exactly what distributed tracing does. Each step becomes a span, with the inputs, outputs, tokens, cost and timing attached. When a user complains, you can open the trace and see that, for example, the retrieval step returned the wrong documents.
OpenTelemetry, which many of us already use for normal services, has semantic conventions for generative AI: standard attribute names for things like the model used, token counts and operation type. Libraries like OpenLLMetry add automatic instrumentation for popular LLM SDKs and frameworks.
The benefit: AI traces can flow into the same backend as the rest of your traces (Tempo, Jaeger, Datadog, Honeycomb and so on), so you see the AI step inside the full user request.
One important warning: prompts and responses can contain personal data. Decide carefully what you record, mask sensitive fields, and set retention limits.
Besides general observability tools, there's a group of tools built for LLM applications:
For my learning project, I'd start with Evidently for the classic model (it's already in the plan) and try Langfuse or Phoenix once an LLM is involved.
Monitoring tells you about problems after users see them. Evaluations try to catch them before.
The idea: keep a set of test questions with good expected answers. Every time you change a prompt, a model or the retrieval logic, run the set and score the results, automatically or with another model as a judge. If quality drops, the pipeline fails, just like a failing unit test.
It's not perfect, because "good answer" is fuzzy. But a basic evaluation set catches a surprising number of regressions, especially when switching models.
With monitoring in place, the loop is complete: build, test, deploy, watch, improve. Next, I want to look at what to do when monitoring shows drift: retraining, versioning and safe rollouts of new model versions.
My take: monitor AI systems twice. Once like any service, and once like a new colleague whose work you still need to check.
— Desly