OpenTelemetry from the ground up
Traces, metrics and logs with one standard, and no vendor lock-in.
Traces, metrics and logs with one standard, and no vendor lock-in.
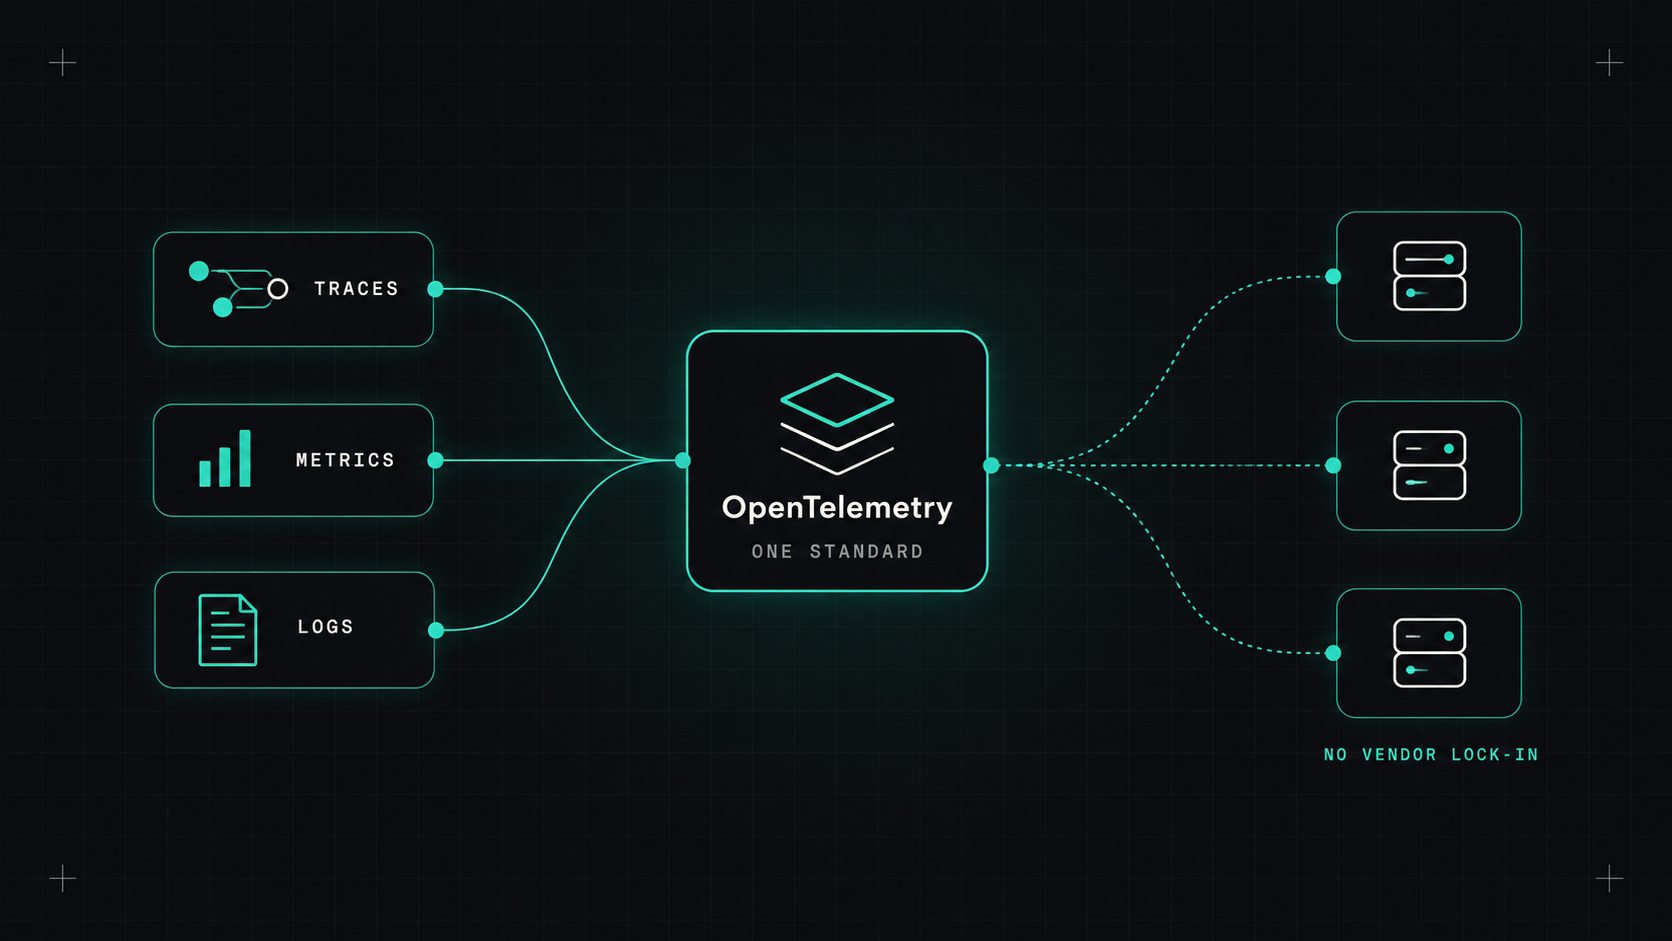
For years, observability meant choosing a vendor and installing their agent everywhere. Then their SDK in your code. Then their query language in your head. Switching vendors meant re-instrumenting everything, so nobody switched, and prices went up.
OpenTelemetry changed that. It's now the second most active CNCF project after Kubernetes, and the standard way to collect telemetry. If you're starting with observability today, start here.
OpenTelemetry (often shortened to OTel) is a set of open standards, SDKs and tools for generating and collecting telemetry data. The key idea: instrument once, send anywhere.
Your code and infrastructure produce data in a standard format. Where that data goes, Prometheus, Grafana, Jaeger, Datadog, Honeycomb, New Relic, Elastic or anything else, is just configuration. Change the backend, keep the instrumentation.
Traces follow a single request through your system. A trace is made of spans, one per operation: the HTTP request, the database query, the call to another service. Traces answer "where did the time go?" and "where did it fail?"
Metrics are numbers over time: request rate, error rate, latency percentiles, CPU usage, queue length. Cheap to store, great for dashboards and alerts.
Logs are timestamped events. OpenTelemetry can attach trace IDs to logs, so you can jump from a log line to the full trace of the request that produced it.
Profiles show which code is using CPU and memory. This is the newest signal in OpenTelemetry, still maturing.
The magic happens when they're connected: a spike in a latency metric, linked to example traces, linked to the logs of the slow requests.
Metrics tell you something is wrong. Traces tell you where. Logs tell you why.
http.request.method or db.system, so data looks the same everywhere.The fastest way to see OpenTelemetry in action is auto-instrumentation. For a Python app:
pip install opentelemetry-distro opentelemetry-exporter-otlp
opentelemetry-bootstrap -a install

export OTEL_SERVICE_NAME=shop-api
export OTEL_EXPORTER_OTLP_ENDPOINT=http://otel-collector:4317
opentelemetry-instrument python app.py
For Java, attach the agent with -javaagent:opentelemetry-javaagent.jar. For Node.js, load the auto-instrumentation package at startup. On Kubernetes, the OpenTelemetry Operator can even inject auto-instrumentation into pods with a single annotation.
Within minutes, every incoming request, outgoing HTTP call and database query becomes a span.
Then add a few manual spans for important business operations:
from opentelemetry import trace

tracer = trace.get_tracer("shop")

def place_order(order):
    with tracer.start_as_current_span("place_order") as span:
        span.set_attribute("order.items", len(order.items))
        # ... business logic
I always send telemetry to a Collector first, rather than directly from apps to a backend. It decouples apps from vendors and lets you process data centrally.
receivers:
  otlp:
    protocols:
      grpc:
      http:

processors:
  memory_limiter:
    check_interval: 1s
    limit_percentage: 80
  batch:
  attributes:
    actions:
      - key: user.email
        action: delete      # don't ship personal data

exporters:
  otlp/tempo:
    endpoint: tempo:4317
    tls:
      insecure: true
  prometheusremotewrite:
    endpoint: http://prometheus:9090/api/v1/write

service:
  pipelines:
    traces:
      receivers: [otlp]
      processors: [memory_limiter, attributes, batch]
      exporters: [otlp/tempo]
    metrics:
      receivers: [otlp]
      processors: [memory_limiter, batch]
      exporters: [prometheusremotewrite]
A common pattern on Kubernetes: a Collector as a DaemonSet on every node (receiving from local pods and collecting node data), sending to a central gateway Collector that handles sampling, filtering and exporting.
With the Collector in the middle, changing or adding a backend is a configuration change. Popular open-source destinations:
Or any commercial vendor that accepts OTLP, which today is almost all of them.
service.name on everything. Without it, your data is a mess.Absolutely. OpenTelemetry is where the whole industry is going. Instrumenting with it today means you'll never have to re-instrument just because you changed vendors, and you get traces, metrics and logs that finally talk to each other.
My take: instrument once, with an open standard, and keep the freedom to change your mind about everything else.
— Desly