When the monitoring bill beats the server bill
How to cut observability costs without flying blind.
How to cut observability costs without flying blind.
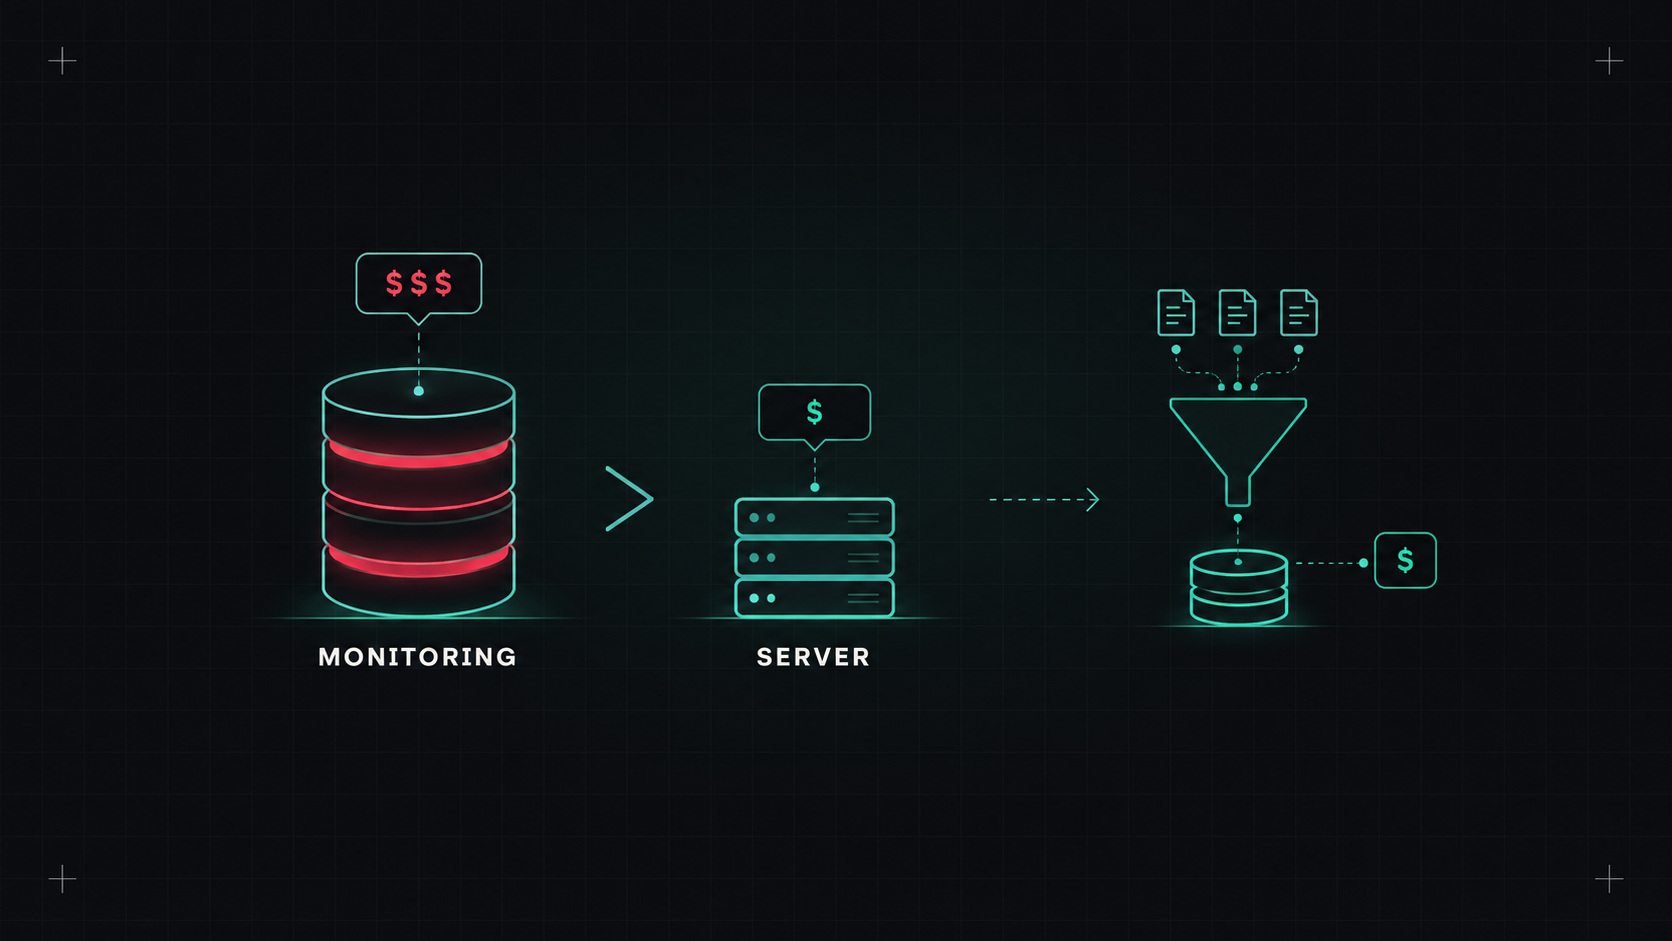
There's a moment many companies reach: someone in finance asks why the observability invoice is bigger than the compute bill for the systems being observed. It sounds absurd, but it happens a lot. Observability costs have quietly become one of the biggest line items in many infrastructure budgets.
Most of that data isn't actually used. Cutting it doesn't mean losing sight of what's happening. It means being selective about what you keep.
user_id, request_id or full URLs creates a separate time series for every unique value. Millions of series, each one billed.Before cutting anything, measure:
You'll almost always find that a handful of services and metrics account for most of the bill.
The cheapest telemetry is the telemetry you decided not to collect, because you knew nobody would miss it.
You don't need every trace. You need the interesting ones.
Head sampling decides at the start of a request whether to keep it, for example 10% of requests. Simple and cheap, but it might throw away the one failed request you needed.
Tail sampling decides after the trace is complete, so it can keep all errors, all slow requests, and only a small percentage of normal ones. The OpenTelemetry Collector supports this:
processors:
  tail_sampling:
    decision_wait: 10s
    policies:
      - name: keep-errors
        type: status_code
        status_code: { status_codes: [ERROR] }
      - name: keep-slow
        type: latency
        latency: { threshold_ms: 1000 }
      - name: sample-the-rest
        type: probabilistic
        probabilistic: { sampling_percentage: 5 }
You keep everything useful for debugging, and drop 90%+ of the volume.
info or warn in production, debug only when investigating, ideally switchable at runtime./orders/{id} instead of /orders/12345.Commercial platforms are convenient and powerful, but pricing based on hosts, ingested gigabytes or custom metrics can grow quickly.
Open-source stacks (Prometheus or Mimir, Loki, Tempo, Grafana, or ClickHouse-based tools like SigNoz) can be much cheaper at scale, especially with object storage. But they need people to run them, and that's a real cost too.
Many companies end up with a mix: OpenTelemetry everywhere, the Collector routing data, high-value data to a commercial tool, bulk data to cheaper self-hosted storage. Because OTel is vendor-neutral, you can change that split whenever pricing changes.
Find your top five data producers. Turn on tail sampling for traces, drop health check logs, and remove your highest-cardinality labels. Those three changes alone often cut the bill dramatically, and nobody notices any loss in visibility.
My take: observability should help you understand your system, not compete with it for budget. Collect with intention, keep what you use, and let the rest go.
— Desly