Are we actually getting faster? Measuring DevOps with DORA
Five numbers that tell you how your delivery is really going, and the vanity metrics to ignore.
Five numbers that tell you how your delivery is really going, and the vanity metrics to ignore.
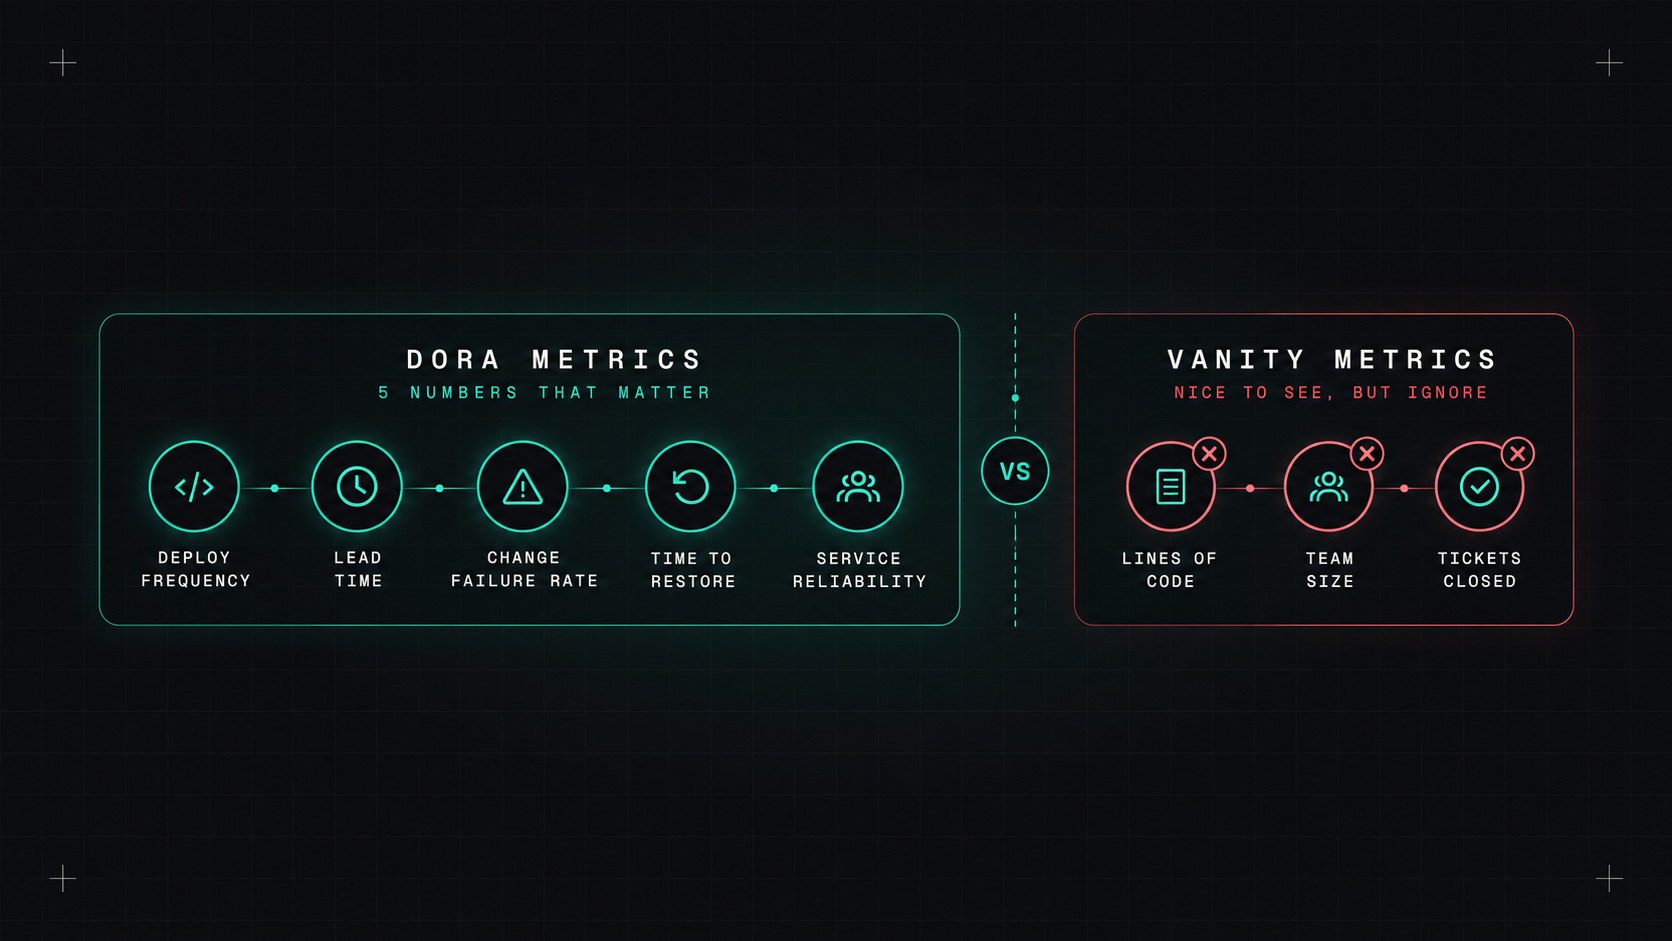
"We're doing DevOps now." Great. But is it working? Are we shipping faster? Breaking less? Recovering quicker? Most teams can't answer those questions with anything better than a feeling.
DORA metrics help answer those questions. They come from years of research by the DevOps Research and Assessment team (now part of Google Cloud), and they're the closest thing our industry has to a shared scoreboard.
Deployment frequency. How often do you release to production? Daily, weekly, monthly?
Lead time for changes. How long does it take for a committed change to reach production? Hours or weeks?
Change failure rate. What percentage of deployments cause a problem that needs a fix, a rollback or a hotfix?
Time to restore service. When something breaks in production, how long until it's working again?
Rework rate. The newest addition: how many deployments are unplanned, made just to fix problems from earlier deployments?
The first two measure speed. The others measure stability. The key finding behind DORA is that these don't fight each other. The best teams are both faster and more stable. Small, frequent changes are easier to test, easier to review and easier to roll back.
Speed and stability aren't a trade-off. Teams that ship small changes often tend to break less, not more.
The recent DORA reports have focused heavily on AI-assisted development. The headline is more nuanced than the marketing: AI helps individuals write code faster, but it can also lead to bigger batches of change, and bigger batches tend to hurt stability.
The teams that benefit most from AI are the ones that already have strong foundations: good tests, small batches, fast feedback, and a solid internal platform. AI amplifies what's already there, good or bad.
You don't need a big tool to start. Most of the data already exists:
There are open-source options like the DORA team's Four Keys project as inspiration, and many commercial tools (LinearB, Sleuth, Swarmia, DX, GitLab and GitHub insights) that calculate them automatically.
Start rough. A weekly script that counts deployments and incidents is better than a perfect dashboard you never build.
Some metrics look good on a slide but tell you very little:
The DORA metrics work best at the team level, used by the team itself to improve. The moment they're used to rank individuals or punish teams, people start optimising the number instead of the system.
DORA measures delivery. It doesn't measure whether developers are happy, focused or burning out. Frameworks like SPACE and DevEx add that human side: satisfaction, flow, cognitive load, interruptions. A short quarterly survey is a good companion to the DORA numbers.
Yes, but with care. Pick the DORA metrics, measure them roughly, look at trends rather than absolute values, and talk about them as a team. When a number moves, ask why.
My take: measure the system, not the people. The goal is to learn where it hurts, not to win a leaderboard.
— Desly